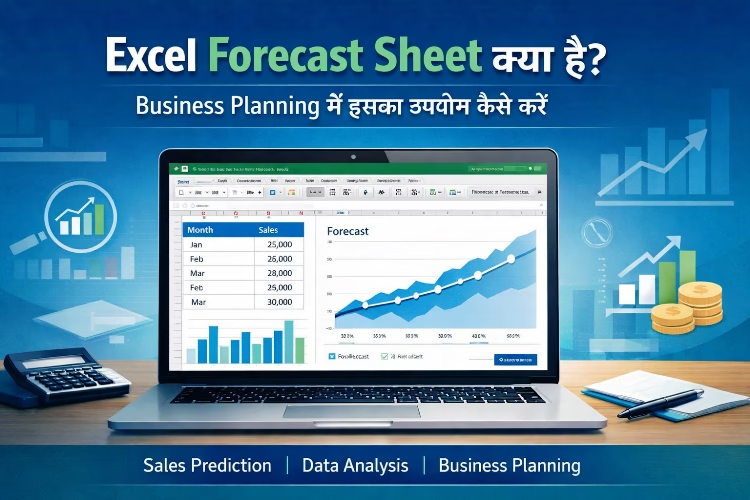
Excel Forecast Sheet
आज के समय में हर business को future planning की जरूरत होती है। अगर किसी कंपनी या छोटे business को यह पता चल जाए कि आने वाले महीनों में sales, expenses या demand कैसी रहने वाली है, तो वह पहले से बेहतर planning कर सकता है। इसी काम को आसान बनाने के लिए Excel Forecast Sheet का उपयोग किया जाता है।
Excel Forecast Sheet एक ऐसा powerful feature है जिसकी मदद से पिछले data के आधार पर भविष्य का अनुमान (Prediction) लगाया जा सकता है। यह feature खासतौर पर sales forecasting, demand planning और financial analysis के लिए बहुत उपयोगी माना जाता है।
Excel Forecast Sheet क्या होती है?
Excel Forecast Sheet एक data analysis tool है जो historical data यानी पिछले समय के data को analyze करके भविष्य के trends का अनुमान लगाता है।
जब किसी business के पास पिछले महीनों या सालों का data होता है, जैसे:
- Monthly Sales
- Product Demand
- Expenses
- Revenue
तो Excel उस data के pattern को समझकर आने वाले समय का forecast तैयार कर देता है।
यह feature Excel में chart और table दोनों के रूप में result दिखाता है जिससे data को समझना आसान हो जाता है।
Business Planning में Forecast Sheet क्यों जरूरी है?
Business planning में forecasting का बहुत महत्वपूर्ण role होता है। अगर business owner को future demand का अंदाजा हो जाता है तो वह कई महत्वपूर्ण decisions पहले से ले सकता है।
Forecast Sheet के उपयोग से:
- Future sales का अनुमान लगाया जा सकता है
- Budget planning आसान हो जाती है
- Stock management बेहतर किया जा सकता है
- Marketing strategy को सही तरीके से बनाया जा सकता है
- Business risk कम किया जा सकता है
इसलिए बड़े business से लेकर छोटे shop owners तक forecasting tools का उपयोग करते हैं।
Excel Forecast Sheet कैसे बनाएं?
Excel में Forecast Sheet बनाना काफी आसान है। इसके लिए आपको कुछ basic steps follow करने होते हैं।
Step 1: Historical Data तैयार करें
सबसे पहले आपको Excel sheet में पिछले समय का data तैयार करना होगा।
Example:
| Month | Sales |
| Jan | 25000 |
| Feb | 27000 |
| Mar | 30000 |
| Apr | 32000 |
Step 2: Data को Select करें
अब Date और Sales वाले पूरे data को select करें।
Step 3: Data Tab में जाएं
Excel के menu bar में Data Tab पर क्लिक करें।
Step 4: Forecast Sheet Option चुनें
Data tab में आपको Forecast Sheet का option दिखाई देगा। उस पर क्लिक करें।
Step 5: Chart Type Select करें
यहां Excel आपको दो प्रकार के chart देता है:
- Line Chart
- Column Chart
आप अपनी जरूरत के अनुसार chart चुन सकते हैं।
Step 6: Forecast Create करें
अब Create button पर क्लिक करें। Excel automatically future sales का prediction तैयार कर देगा।
Excel Forecast Sheet के मुख्य फायदे
- Future Sales Prediction
यह tool पिछले data के आधार पर आने वाली sales का अनुमान लगाने में मदद करता है।
- Better Business Decisions
Business owner forecasting के आधार पर सही decision ले सकता है।
- Data Visualization
Forecast sheet में chart और graph की मदद से data को आसानी से समझा जा सकता है।
- Time Saving
Manual calculation करने की जरूरत नहीं पड़ती। Excel automatically forecast तैयार कर देता है।
- Financial Planning
Business budget और financial planning को बेहतर बनाया जा सकता है।
Excel Forecast Sheet कहां उपयोग होती है?
Forecasting का उपयोग कई industries में किया जाता है जैसे:
- Sales Forecasting
- Retail Business
- Stock Management
- Financial Planning
- Marketing Analysis
- Production Planning
छोटे business owners भी monthly sales forecast के लिए इसका उपयोग करते हैं।
Excel Forecast Sheet का उदाहरण
मान लीजिए किसी shop के पास पिछले 12 महीनों की sales data है। Excel उस data को analyze करके अगले 6 महीनों की sales का अनुमान लगा सकता है।
इससे shop owner को यह पता चल जाता है कि किस महीने में ज्यादा stock रखना होगा और किस महीने में demand कम हो सकती है।
Conclusion
Excel Forecast Sheet business planning के लिए एक powerful tool है। इसकी मदद से companies और small businesses भविष्य के trends को समझ सकते हैं और बेहतर decision ले सकते हैं।
अगर किसी business के पास historical data उपलब्ध है, तो Excel Forecast Sheet के माध्यम से sales prediction, budget planning और demand forecasting आसानी से की जा सकती है।
आज के competitive business environment में data-based decision लेना बहुत जरूरी है और Excel Forecast Sheet इस काम को काफी आसान बना देती है।
FAQ Section
1. Excel Forecast Sheet क्या होती है?
Excel Forecast Sheet एक ऐसा feature है जो पिछले data (Historical Data) के आधार पर भविष्य के trends का अनुमान लगाता है। इसकी मदद से sales, demand और revenue का prediction किया जा सकता है।
2. Excel में Forecast Sheet किस tab में मिलती है?
Excel में Forecast Sheet का option Data Tab में मिलता है। यहां से आप selected data के आधार पर forecasting chart और table बना सकते हैं।
3. Excel Forecast Sheet बनाने के लिए कौन-सा data जरूरी होता है?
Forecast Sheet बनाने के लिए आपको Date या Time Series Data और उससे संबंधित Values (जैसे Sales या Revenue) की जरूरत होती है। Excel उसी data के pattern के आधार पर future prediction तैयार करता है।
4. Excel Forecast Sheet किन industries में उपयोग होती है?
Excel Forecast Sheet का उपयोग कई क्षेत्रों में किया जाता है जैसे:
Sales Forecasting
Retail Business
Financial Planning
Marketing Analysis
Stock Management
5. क्या छोटे business owners भी Excel Forecast Sheet का उपयोग कर सकते हैं?
हाँ, छोटे business owners भी अपनी monthly sales, expenses और demand का अनुमान लगाने के लिए Excel Forecast Sheet का उपयोग कर सकते हैं।
6. Excel Forecast Sheet से business planning कैसे बेहतर होती है?
Forecast Sheet future trends का अनुमान देती है जिससे business owner पहले से stock planning, budget management और marketing strategy तैयार कर सकते हैं।