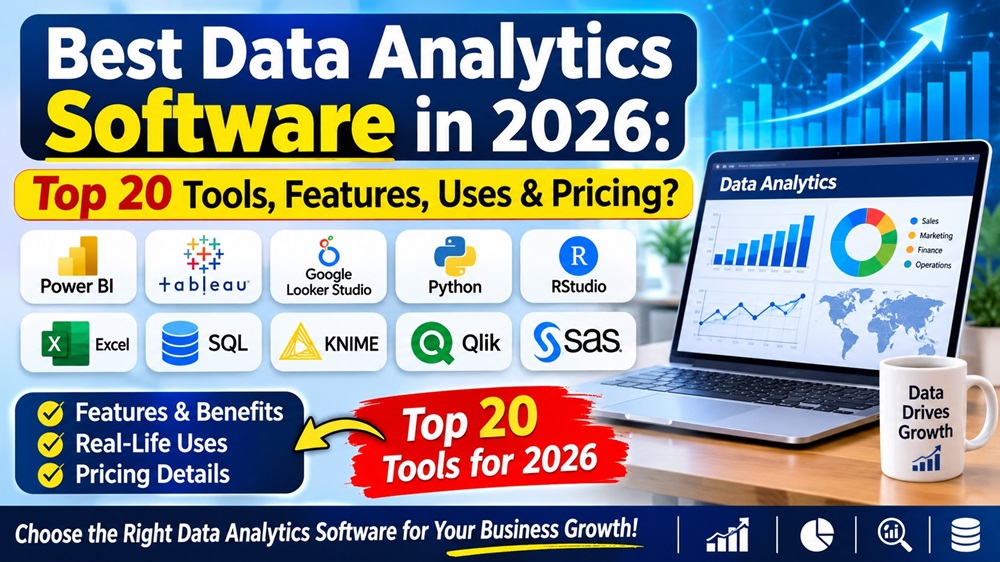
Discover the best data analytics software for beginners, students, MIS executives, data analysts and businesses. Compare features, applications, free tools and pricing.
Explore Top 20 Tools ↓Last Updated: November 2026 | Category: Data Analytics & Technology
Introduction: What Is Data Analytics Software?
Data Analytics Software is a collection of computer applications and tools used to collect, clean, process, analyze and visualize data. These tools help individuals and organizations convert raw data into meaningful information for better decision-making.
Today, companies generate huge amounts of data through sales, websites, customers, financial transactions, marketing campaigns and business operations. Analyzing this information manually can be time-consuming. Data analytics software makes the process faster and more organized.
For example, a company can use Microsoft Excel to manage sales records, SQL to retrieve customer information, Python to perform advanced analysis and Power BI to create interactive business dashboards.
In this article, we will explore 20 popular data analytics tools, their features, uses, advantages, limitations and pricing models.
Table of Contents
Top 20 Best Data Analytics Software in 2026
The following tools cover spreadsheet analysis, business intelligence, programming, database management, statistical analysis and AI-powered analytics.
1. Microsoft Excel
Microsoft Excel is one of the most widely used spreadsheet applications for data entry, calculations, reporting and business analysis.
Key Features:- Pivot Tables and Pivot Charts
- VLOOKUP, XLOOKUP and INDEX-MATCH
- Power Query and Power Pivot
- Advanced formulas and dashboards
- Data cleaning and visualization
Paid subscription / eligible web access
Best For: Beginners, MIS Executives and business analysts.
Official Website →2. Microsoft Power BI
Power BI is a business intelligence and data visualization platform developed by Microsoft. It helps users build interactive dashboards and reports.
Key Features:- Power Query data transformation
- DAX formulas and calculations
- Interactive dashboards
- Multiple data source connections
- Report sharing and collaboration
Desktop: Free | Pro: ₹1,165/user/month*
Best For: Data Analysts, MIS Executives and business professionals.
Official Website →3. Tableau
Tableau is a professional data visualization platform that transforms complex datasets into interactive charts, dashboards and reports.
Key Features:- Drag-and-drop visual analytics
- Interactive dashboards
- Advanced charts and maps
- Data exploration
- Business reporting
Free edition / Paid plans
Best For: Professional data analysts and visualization specialists.
Official Website →4. Python
Python is a popular programming language used for data analysis, automation, statistical computing and machine learning.
Key Features:- Pandas for data manipulation
- NumPy for numerical calculations
- Matplotlib and Seaborn for charts
- Scikit-learn for machine learning
- Jupyter Notebook support
Free and Open Source
Best For: Aspiring Data Analysts and Data Scientists.
Official Website →5. SQL
SQL (Structured Query Language) is used to store, retrieve, filter and manage data in relational databases.
Key Features:- SELECT and WHERE queries
- JOIN operations
- GROUP BY and ORDER BY
- Aggregate functions
- Data filtering and management
Free learning and multiple free database options
Best For: Data Analysts, Database Analysts and BI Developers.
MySQL Website →6. Google Looker Studio
Google Looker Studio is a reporting and dashboard platform used to visualize business and marketing data.
Key Features:- Interactive reporting
- Google Analytics integration
- Google Sheets connections
- Custom reports
- Shareable dashboards
Free standard version | Pro paid
Best For: Digital Marketers, SEO Professionals and small businesses.
Official Website →7. R Programming
R is a programming language and environment designed for statistical computing, research and data visualization.
Key Features:- Statistical analysis
- Data visualization with ggplot2
- Data manipulation with dplyr
- Statistical modelling
- Research reporting
Free and Open Source
Best For: Researchers, Statisticians and Data Scientists.
Official Website →8. Qlik Sense
Qlik Sense is a business analytics platform designed for data exploration, dashboard creation and reporting.
Key Features:- Associative data exploration
- Interactive visualizations
- Data integration
- Automated analytics
- Business reporting
Paid plans / Trial availability
Best For: Medium-sized businesses and enterprises.
Official Website →9. Zoho Analytics
Zoho Analytics is a self-service business intelligence platform that helps businesses analyze data and create reports.
Key Features:- Drag-and-drop reporting
- Data blending
- AI-assisted analytics
- Business dashboards
- Application integrations
Free plan / Paid plans
Best For: Small businesses and growing organizations.
Official Website →10. Google BigQuery
BigQuery is Google's cloud data warehouse designed to store and analyze large datasets using SQL.
Key Features:- Large-scale data processing
- SQL-based analysis
- Cloud data warehousing
- Machine learning capabilities
- Google Cloud integration
Usage-based pricing / Free tier subject to limits
Best For: Data Engineers and enterprise data teams.
Official Website →11. Apache Superset
Apache Superset is an open-source business intelligence application for exploring data and building dashboards.
Key Features:- Interactive dashboards
- SQL Lab query editor
- Data visualization
- Database connectivity
- Custom charts
Free and Open Source
Best For: Technical teams and developers.
Official Website →12. Metabase
Metabase is a business intelligence tool that allows users to explore data and create dashboards with minimal coding.
Key Features:- No-code data questions
- SQL query editor
- Interactive dashboards
- Database integration
- Report sharing
Free Open Source / Paid Cloud plans
Best For: Startups and small analytics teams.
Official Website →13. Snowflake
Snowflake is a cloud data platform that helps organizations store, process and analyze large amounts of data.
Key Features:- Cloud data warehousing
- SQL analytics
- Data sharing
- Scalable computing
- Data engineering support
Consumption-based pricing
Best For: Enterprise analytics and data engineering.
Official Website →14. Databricks
Databricks is a data intelligence platform that combines data engineering, analytics, data science and AI workloads.
Key Features:- Lakehouse architecture
- Apache Spark support
- Machine learning workflows
- Data engineering
- Collaborative notebooks
Usage-based / Paid plans
Best For: Data Engineers and Data Scientists.
Official Website →15. IBM Cognos Analytics
IBM Cognos Analytics is a business intelligence platform used for reporting, dashboards and enterprise data analysis.
Key Features:- Enterprise reporting
- Interactive dashboards
- AI-assisted insights
- Data visualization
- Report scheduling
Paid plans / Custom pricing
Best For: Large organizations and enterprises.
Official Website →16. SAS Analytics
SAS offers advanced analytical software for statistical analysis, forecasting and enterprise decision-making.
Key Features:- Statistical analysis
- Predictive modelling
- Advanced data management
- Forecasting
- Machine learning
Paid / Customized plans
Best For: Research institutions and large enterprises.
Official Website →17. KNIME Analytics Platform
KNIME is a visual data analytics platform that allows users to build data workflows without writing extensive code.
Key Features:- Visual workflow builder
- Data preparation
- Machine learning workflows
- Data integration
- Workflow automation
Free desktop platform / Paid services
Best For: Beginners and analytics professionals.
Official Website →18. Alteryx
Alteryx is an analytics automation platform designed to prepare, process and analyze data through visual workflows.
Key Features:- Data preparation
- Workflow automation
- Predictive analytics
- Data blending
- Business process automation
Paid subscription / Custom pricing
Best For: Business analysts and enterprise teams.
Official Website →19. SPSS Statistics
IBM SPSS Statistics is a statistical analysis application used in research, surveys and academic projects.
Key Features:- Descriptive statistics
- Regression analysis
- Hypothesis testing
- Survey data analysis
- Statistical reporting
Paid subscription / Trial options
Best For: Researchers, students and statisticians.
Official Website →20. Julius AI
Julius AI is an AI-powered data analysis tool that helps users explore datasets and generate insights using natural-language instructions.
Key Features:- AI-assisted data analysis
- Spreadsheet and file analysis
- Charts and visualizations
- Natural-language questions
- Analytical summaries
Free tier / Paid plans
Best For: Beginners and professionals exploring AI analytics.
Official Website →Data Analytics Software Comparison Table
The following table compares 20 tools based on their primary applications and pricing models.
| Software | Main Use | Pricing Category | Skill Level |
|---|---|---|---|
| Microsoft Excel | Spreadsheet Analysis | Paid / Eligible web access | Beginner |
| Power BI | Business Dashboards | Free / Paid | Beginner to Advanced |
| Tableau | Data Visualization | Free / Paid | Intermediate |
| Python | Data Science | Free | Intermediate |
| SQL | Database Analysis | Free options | Beginner to Advanced |
| Looker Studio | Marketing Reports | Free / Pro | Beginner |
| R | Statistical Analysis | Free | Intermediate |
| Qlik Sense | Business Intelligence | Paid / Trial | Intermediate |
| Zoho Analytics | Business Reporting | Free / Paid | Beginner |
| BigQuery | Big Data Analytics | Usage-based | Advanced |
| Apache Superset | Dashboards | Free / Open Source | Advanced |
| Metabase | Business Reporting | Free / Paid | Beginner to Advanced |
| Snowflake | Cloud Data Warehouse | Usage-based | Advanced |
| Databricks | Big Data and AI | Usage-based | Advanced |
| IBM Cognos | Enterprise BI | Paid | Advanced |
| SAS Analytics | Predictive Analysis | Paid | Advanced |
| KNIME | Data Workflows | Free / Paid | Beginner to Advanced |
| Alteryx | Analytics Automation | Paid | Intermediate |
| SPSS | Statistical Research | Paid | Intermediate |
| Julius AI | AI Data Analysis | Free / Paid | Beginner |
Best Free Data Analytics Software in 2026
If you are a student, beginner or job seeker, you do not need to purchase expensive software to start learning data analytics. Several excellent tools have free desktop, community or open-source versions.
| Free Tool | What You Can Learn | Suitable For |
|---|---|---|
| Power BI Desktop | Data cleaning and dashboards | Beginners |
| Python | Data analysis and automation | Students |
| Google Looker Studio | Online reporting | Digital Marketers |
| R Programming | Statistical analysis | Researchers |
| KNIME | Visual data workflows | Beginners |
| Apache Superset | Business dashboards | Developers |
| Metabase Open Source | SQL and reporting | Small Teams |
Which Free Software Should Beginners Start With?
For most beginners, a practical starting combination is:
- Microsoft Excel for spreadsheet management.
- Power BI Desktop for dashboard development.
- SQL for database queries.
- Python for advanced data analysis.
Best Data Analytics Software for Beginners
Choosing the right software depends on your current computer knowledge and career goals.
1. For Students
Start with Excel, basic statistics and Power BI. These tools help students understand data cleaning, formulas, charts and reporting.
2. For MIS Executives
Learn Advanced Excel, Pivot Tables, Power Query, Power BI and SQL. These skills are useful for preparing monthly reports, sales dashboards and business performance reports.
3. For Data Analyst Job Seekers
Focus on Excel, SQL, Power BI or Tableau, and Python. Build practical projects using real-world datasets.
4. For Business Owners
Excel, Power BI, Zoho Analytics and Looker Studio can help monitor sales, marketing performance, customer data and business KPIs.
Excel vs Power BI vs Tableau: Which Is Best?
Excel, Power BI and Tableau are three popular tools used for business data analysis. However, each has a different purpose.
| Feature | Excel | Power BI | Tableau |
|---|---|---|---|
| Data Entry | Excellent | Limited | Limited |
| Data Cleaning | Power Query | Power Query | Preparation tools |
| Formulas | Advanced Excel formulas | DAX | Calculated Fields |
| Dashboards | Good | Excellent | Excellent |
| Large Datasets | Worksheet limits apply | Model and capacity dependent | Data-source dependent |
| Learning Curve | Beginner-friendly | Moderate | Moderate |
| Best Use | Spreadsheet Analysis | Business Intelligence | Advanced Visualization |
How to Choose the Best Data Analytics Software?
Before selecting data analytics software, consider the following factors:
1. Your Career Objective
Choose tools according to your target role, such as MIS Executive, Data Analyst, Business Analyst or Data Scientist.
2. Ease of Learning
Beginners should start with Excel, Power BI or Looker Studio before moving towards advanced programming and big data platforms.
3. Pricing and Budget
Compare free plans, subscription fees, cloud usage charges and business licensing requirements.
4. Data Visualization
If you need interactive dashboards and reports, consider Power BI, Tableau, Qlik or Looker Studio.
5. Data Sources and Integration
Check whether the software supports your existing Excel files, CSV files, SQL databases, cloud applications and business systems.
6. Scalability and Security
Businesses should evaluate access control, data governance, security, cloud infrastructure and the ability to handle growing datasets.
Career Opportunities After Learning Data Analytics Software
Data analytics skills are useful across industries such as banking, retail, healthcare, education, finance, e-commerce, IT and marketing.
Some career options include:
- MIS Executive
- Data Analyst
- Business Analyst
- Reporting Analyst
- Power BI Developer
- Business Intelligence Analyst
- Junior Data Scientist
- Marketing Data Analyst
- Financial Data Analyst
Essential Skills for a Data Analyst
- Advanced Microsoft Excel
- SQL and Database Management
- Power BI or Tableau
- Python Fundamentals
- Data Cleaning and Data Transformation
- Data Visualization
- Business Reporting and Communication
Data Analytics Learning Roadmap for Beginners
Follow this suggested learning sequence to build practical data analytics skills.
Stage 1: Basic Computer and Excel
Learn spreadsheets, formulas, sorting, filtering, charts and Pivot Tables.Stage 2: Advanced Excel
Practice XLOOKUP, IF, SUMIFS, COUNTIFS, Power Query and dashboards.Stage 3: Power BI
Learn data import, data modelling, DAX, visualization and interactive dashboards.Stage 4: SQL
Practice SELECT, WHERE, JOIN, GROUP BY and subqueries.Stage 5: Python
Learn Pandas, NumPy, Matplotlib and basic data analysis.Stage 6: Practical Projects
Create sales dashboards, HR reports, financial analysis and business performance reports.Practical Data Analytics Projects for Students
The best way to learn data analytics software is by completing practical assignments and projects.
- Sales Performance Dashboard using Excel.
- Employee Attendance and Salary Analysis.
- Student Admission and Fee Management Dashboard.
- Monthly Revenue Analysis using Power BI.
- Customer Purchase Analysis using SQL.
- Website Traffic Analysis using Looker Studio.
- Data Cleaning Project using Python.
- Business Profit and Loss Dashboard.
Learn Data Analytics with AI in Lucknow
Want to learn Excel, Power BI, SQL, data analysis and AI tools through practical training?
Join Excellent Computer Education, Indira Nagar, Lucknow.
View Course Details WhatsApp for AdmissionAddress: UG-10, Goel Palace, Faizabad Road, Indira Nagar, Lucknow – 226016.
Contact: 9795720993
Website: excellentcomputereducation.com
Frequently Asked Questions (FAQs)
1. Which is the best data analytics software in 2026?
Microsoft Excel, Power BI, Tableau, Python and SQL are among the most popular tools for data analytics. The best choice depends on your requirements and experience.
2. Which data analytics software is best for beginners?
Microsoft Excel and Power BI Desktop are good starting points. Beginners can learn data cleaning, formulas, charts, reporting and dashboard creation.
3. Which data analytics software is free?
Python, R, Power BI Desktop, Google Looker Studio, Apache Superset and KNIME offer free options. Some platforms also have paid features.
4. Is Excel enough for data analytics?
Excel is useful for spreadsheet-based data analysis, but professional analytics work may also require SQL, Power BI, Python and other specialized tools.
5. Is Power BI better than Tableau?
Power BI is a strong choice for Microsoft-based business reporting and cost-conscious teams. Tableau is particularly useful for advanced visual exploration and interactive data visualization.
6. Is Python necessary for data analytics?
Python is not compulsory for every entry-level data analyst role, but it is useful for automation, advanced analysis, statistical computing and machine learning.
7. Which software is used by MIS Executives?
MIS Executives commonly use Microsoft Excel, Power BI, SQL and reporting applications to prepare business reports, dashboards and performance analysis.
8. Can I learn data analytics without coding?
Yes. You can start with Excel, Power BI and Looker Studio without extensive programming knowledge. Learning SQL and Python later will expand your capabilities.
9. What are the main skills required for a Data Analyst?
Important skills include Excel, SQL, Power BI or Tableau, data cleaning, statistics, visualization, problem-solving and communication.
10. Where can I learn Data Analytics in Lucknow?
Excellent Computer Education in Indira Nagar, Lucknow offers job-oriented computer training. Contact 9795720993 to enquire about the Data Analytics with AI course and current admission details.
Conclusion
Data analytics software plays an important role in modern business decision-making. From Excel spreadsheets to advanced platforms such as Power BI, Tableau, Python, SQL, Snowflake and Databricks, every tool offers different capabilities.
For beginners, starting with Excel and Power BI is a practical approach. As your knowledge increases, you can learn SQL, Python and advanced business intelligence platforms.
If you want to build a career in data analytics, focus on learning practical tools, working with real datasets and creating professional dashboards and projects.
Explore the Data Analytics with AI professional training programme at Excellent Computer Education, Indira Nagar, Lucknow.
Explore Data Analytics Course →Disclaimer: Software features, availability, free plans and subscription prices may change. Always consult the official vendor website for the latest information.
Explore AI Tools & Professional Courses
Upgrade your digital skills with AI tools, Data Analytics and Digital Marketing professional training.
Best AI Tools for Digital Marketing in 2026
Discover powerful AI tools for SEO, content writing, social media marketing, graphic design and digital marketing automation.
Explore AI Tools →Data Analytics with AI Course in Lucknow
Learn Excel, Power BI, data analysis, AI tools, practical projects and essential industry skills for a career in Data Analytics.
View Course Details →Digital Marketing Course in Indira Nagar, Lucknow
Develop practical skills in SEO, Google Ads, social media marketing, content marketing and online business promotion.
Enquire About Course →Build Your Future with Professional Computer Skills!
Join Excellent Computer Education, Indira Nagar, Lucknow and learn practical, job-oriented computer skills.
Enquire Now on WhatsApp