EXCELLENT COMPUTER EDUCATION | LUCKNOW
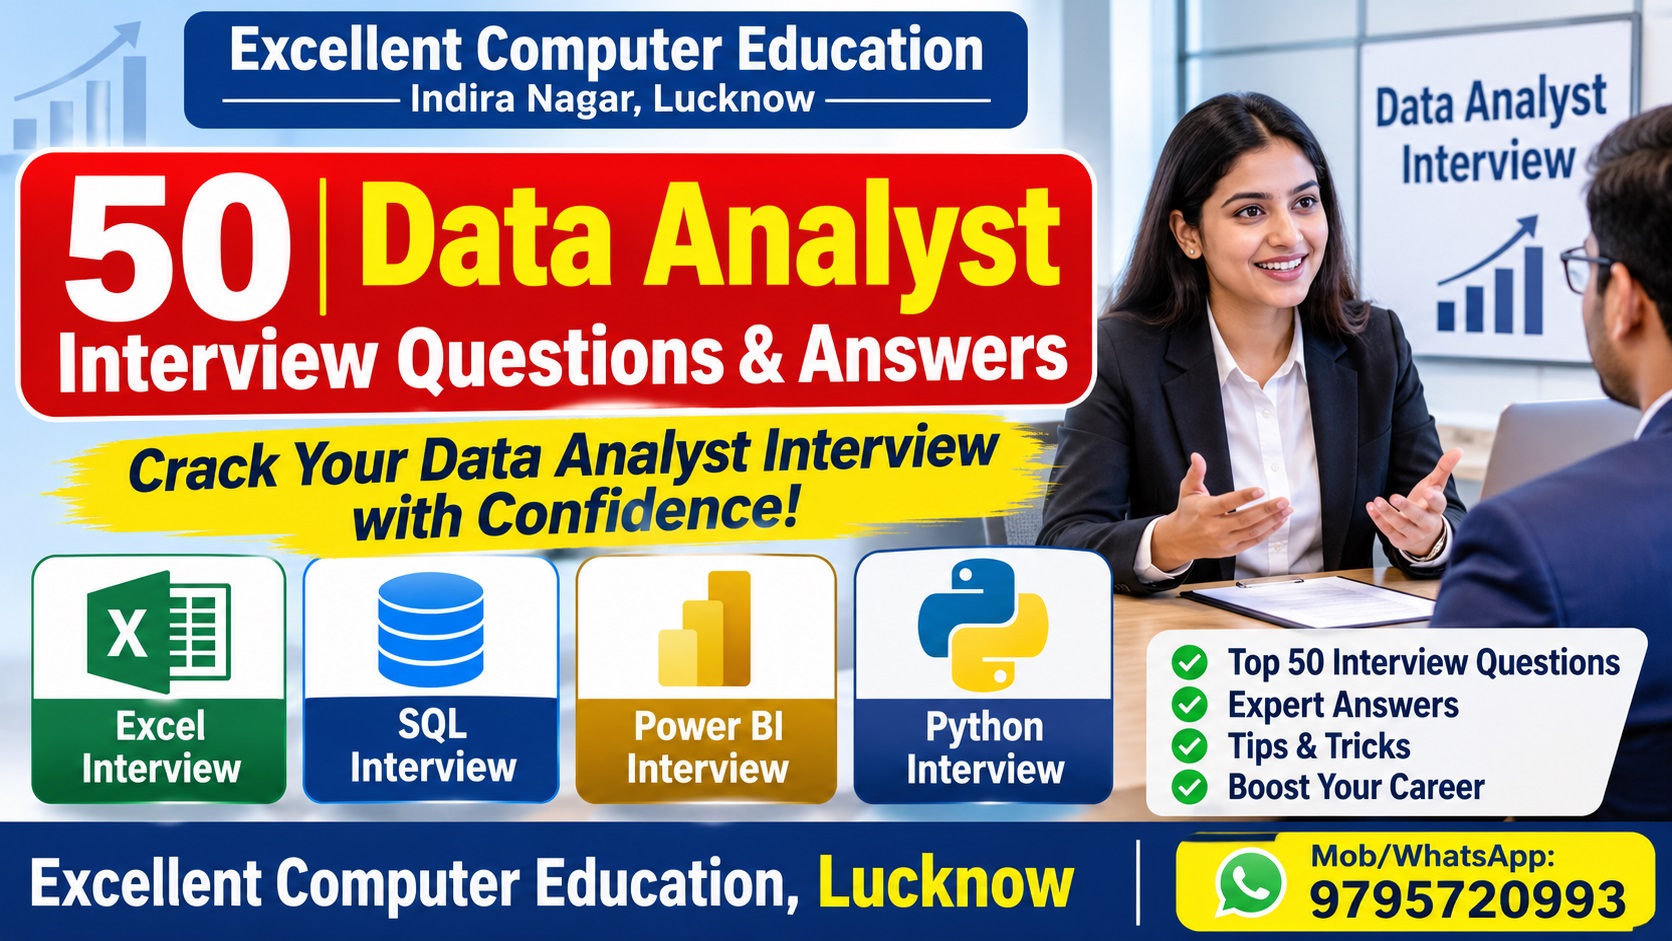
50 Data Analyst Interview Questions और Answers in Hindi
2026 में Data Analyst Job पाने के लिए सीखें 50 Important Interview Questions
Excel | SQL | Power BI | Python | Statistics
Beginner to Advanced Interview Preparation
क्या आप Data Analyst बनना चाहते हैं? क्या आप किसी IT Company, MNC या Corporate Office में Data Analyst की Job के लिए Interview देने की तैयारी कर रहे हैं?
अगर हाँ, तो यह Article आपके लिए उपयोगी है। आज कंपनियां अपने Business Data को समझने, Sales Performance Analyze करने और बेहतर Business Decisions लेने के लिए Data Analysts की मदद लेती हैं।
एक अच्छे Data Analyst को केवल Software चलाना ही नहीं, बल्कि Data को समझना, Clean करना, Analyze करना और सही तरीके से Present करना भी आना चाहिए।
इस Article में हम 50 महत्वपूर्ण Interview Questions और उनके Answers आसान हिंदी भाषा में समझेंगे।
- 10 Basic Data Analytics Questions
- 10 Advanced Excel Interview Questions
- 10 SQL Interview Questions
- 10 Power BI Interview Questions
- 5 Python Interview Questions
- 5 Statistics और Practical Questions
इस Article में क्या-क्या है?
Part 1: Basic Data Analytics Interview Questions
Q1. Data Analytics क्या है?
Answer: Data Analytics एक Process है जिसमें Raw Data को Collect, Clean, Transform और Analyze करके Useful Information प्राप्त की जाती है। इसका उद्देश्य सही Business Decisions लेने में मदद करना है।
Q2. Data Analyst कौन होता है?
Answer: Data Analyst एक Professional होता है जो Business Data को Analyze करके Reports, Charts और Dashboards बनाता है। वह Data में मौजूद Trends और Patterns को पहचानकर Management को बेहतर Decisions लेने में मदद करता है।
Q3. Data और Information में क्या अंतर है?
Answer: Data कच्चे Facts और Values होते हैं, जबकि Information Processed और Organized Data होता है जिसका कोई Meaning होता है। उदाहरण के लिए 500, 700 और 900 Sales Data हैं, जबकि इनका Total 2100 एक उपयोगी Information है।
Q4. Data Analytics के मुख्य प्रकार कौन-कौन से हैं?
Answer: Data Analytics के चार प्रमुख प्रकार हैं:
- Descriptive Analytics – क्या हुआ?
- Diagnostic Analytics – ऐसा क्यों हुआ?
- Predictive Analytics – आगे क्या हो सकता है?
- Prescriptive Analytics – आगे क्या करना चाहिए?
Q5. Structured और Unstructured Data क्या है?
Answer: Structured Data Rows और Columns में व्यवस्थित होता है, जैसे Excel और SQL Tables। Unstructured Data का निश्चित Tabular Format नहीं होता, जैसे Images, Videos, Audio और Documents।
Q6. KPI क्या होता है?
Answer: KPI का पूरा नाम Key Performance Indicator है। इसका उपयोग Business की Performance मापने के लिए किया जाता है। उदाहरण: Total Revenue, Monthly Sales, Customer Retention और Conversion Rate।
Q7. Data Cleaning क्या है?
Answer: Data Cleaning में Dataset की गलतियों को ठीक किया जाता है। इसमें Duplicate Records हटाना, Missing Values Handle करना, गलत Data Types सुधारना और Inconsistent Data को ठीक करना शामिल है।
Q8. Data Visualization क्या है?
Answer: Data Visualization का अर्थ है Data को Charts, Graphs और Dashboards के माध्यम से समझना और प्रस्तुत करना। इससे Complex Data को आसानी से समझा जा सकता है।
Q9. Data Analyst के लिए कौन-कौन से Tools जरूरी हैं?
Answer: मुख्य Tools हैं Microsoft Excel, SQL, Power BI, Python, Tableau, Jupyter Notebook और Statistics Tools। शुरुआती स्तर पर Excel, SQL और Power BI से शुरुआत करना अच्छा विकल्प है।
Q10. Data Analyst और Data Scientist में क्या अंतर है?
Answer: Data Analyst मुख्य रूप से Existing Data को Analyze करके Reports और Insights तैयार करता है। Data Scientist Statistics, Programming और Machine Learning का उपयोग करके Complex Problems और Predictive Models पर काम करता है।
Part 2: Excel Interview Questions and Answers
Q11. VLOOKUP Function क्या है?
Answer: VLOOKUP का उपयोग किसी Table के पहले Column में Value Search करके उसी Row से संबंधित दूसरी Column की Value प्राप्त करने के लिए किया जाता है।
Example:
=VLOOKUP(A2,$F$2:$H$100,2,FALSE)Q12. XLOOKUP और VLOOKUP में क्या अंतर है?
Answer: VLOOKUP केवल पहले Column से Lookup करता है, जबकि XLOOKUP किसी भी दिशा में Lookup कर सकता है। XLOOKUP में Not Found Result देना भी आसान है।
=XLOOKUP(A2,F2:F100,G2:G100,"Not Found")
Q13. Pivot Table क्या है?
Answer: Pivot Table Excel का एक Powerful Data Analysis Tool है। इसका उपयोग बड़े Dataset को Summarize करने के लिए किया जाता है। इससे Month-wise Sales, Product-wise Sales और Region-wise Performance निकाली जा सकती है।
Q14. IF Function क्या है?
Answer: IF Function किसी Condition को Check करता है। यदि Condition TRUE होती है तो एक Result और FALSE होने पर दूसरा Result देता है।
=IF(B2>=40,"Pass","Fail")
Q15. COUNT, COUNTA और COUNTBLANK में क्या अंतर है?
Answer:
- COUNT – Numeric Cells Count करता है।
- COUNTA – Non-empty Cells Count करता है।
- COUNTBLANK – Blank Cells Count करता है।
Q16. Conditional Formatting क्या है?
Answer: Conditional Formatting का उपयोग किसी विशेष Condition के अनुसार Cell का Color, Font और Formatting Automatically Change करने के लिए किया जाता है।
Q17. Data Validation क्या है?
Answer: Data Validation Excel में Data Entry को Control करने वाला Feature है। इससे Dropdown List, Date Range, Number Limits और अन्य Input Rules सेट किए जा सकते हैं।
Q18. SUMIF और SUMIFS में क्या अंतर है?
Answer: SUMIF एक Condition के आधार पर Values का Sum करता है, जबकि SUMIFS Multiple Conditions के आधार पर Sum करता है।
=SUMIF(A2:A100,"North",B2:B100)
=SUMIFS(C2:C100,A2:A100,"North",B2:B100,"Laptop")
Q19. Excel में Duplicate Data कैसे Remove करेंगे?
Answer: Data Tab में जाकर Remove Duplicates Option का उपयोग कर सकते हैं। पहले यह तय करना चाहिए कि किन Columns के आधार पर Duplicate पहचानना है।
Q20. Excel Dashboard क्या है?
Answer: Excel Dashboard एक Visual Reporting Sheet होती है जिसमें Charts, KPI Cards, Pivot Tables, Slicers और अन्य Elements के माध्यम से Business Performance दिखाई जाती है।
Part 3: SQL Interview Questions and Answers
Q21. SQL क्या है?
Answer: SQL का पूरा नाम Structured Query Language है। इसका उपयोग Relational Database में Data को Retrieve, Insert, Update और Delete करने के लिए किया जाता है।
Q22. Primary Key क्या है?
Answer: Primary Key Table के प्रत्येक Record की Unique पहचान होती है। इसमें Duplicate और NULL Values स्वीकार नहीं होतीं।
Q23. Foreign Key क्या है?
Answer: Foreign Key एक Table के Column को दूसरी Table की Primary या Unique Key से जोड़ती है। इससे Tables के बीच Relationship स्थापित किया जाता है।
Q24. WHERE और HAVING में क्या अंतर है?
Answer: WHERE Grouping से पहले Rows Filter करता है, जबकि HAVING GROUP BY के बाद Groups पर Condition लगाता है।
Q25. SQL JOIN क्या है?
Answer: JOIN का उपयोग दो या अधिक Tables के Related Records को Combine करने के लिए किया जाता है। इसके मुख्य प्रकार हैं:
- INNER JOIN
- LEFT JOIN
- RIGHT JOIN
- FULL OUTER JOIN
Q26. GROUP BY का उपयोग क्यों किया जाता है?
Answer: GROUP BY समान Values वाले Records को Group करता है। इसका उपयोग SUM, COUNT, AVG, MIN और MAX जैसे Aggregate Functions के साथ होता है।
SELECT Department, COUNT(*) FROM Employees GROUP BY Department;
Q27. ORDER BY क्या करता है?
Answer: ORDER BY का उपयोग Query के Result को Ascending या Descending Order में Sort करने के लिए किया जाता है।
SELECT * FROM Employees ORDER BY Salary DESC;
Q28. SQL में NULL क्या है?
Answer: NULL का अर्थ है कि किसी Column की Value उपलब्ध या ज्ञात नहीं है। NULL को Check करने के लिए IS NULL या IS NOT NULL का उपयोग किया जाता है।
Q29. DELETE, TRUNCATE और DROP में क्या अंतर है?
Answer:
- DELETE – Table की Selected या सभी Rows Delete करता है।
- TRUNCATE – Table की सभी Rows हटाता है, लेकिन Table Structure रखता है।
- DROP – Table को उसके Structure सहित हटाता है।
Q30. SQL में Duplicate Records कैसे Find करेंगे?
Answer: GROUP BY और HAVING का उपयोग करके Duplicate Values Find कर सकते हैं।
SELECT Email, COUNT(*) FROM Customers GROUP BY Email HAVING COUNT(*) > 1;
Part 4: Power BI Interview Questions and Answers
Q31. Power BI क्या है?
Answer: Power BI Microsoft का Business Intelligence Tool है। इसकी मदद से विभिन्न Data Sources से Data Connect करके Interactive Reports और Dashboards बनाए जाते हैं।
Q32. Power Query क्या है?
Answer: Power Query का उपयोग Data Import, Cleaning और Transformation के लिए किया जाता है। इसमें Remove Columns, Replace Values, Merge Queries और Append Queries जैसे Features उपलब्ध हैं।
Q33. DAX क्या है?
Answer: DAX का पूरा नाम Data Analysis Expressions है। इसका उपयोग Power BI में Measures, Calculated Columns और Calculated Tables बनाने के लिए किया जाता है।
Q34. Measure और Calculated Column में क्या अंतर है?
Answer: Calculated Column Row Level पर Calculation करके Model में Store होता है। Measure Filter Context के अनुसार Dynamic Calculation करता है।
Q35. Power BI में Slicer क्या है?
Answer: Slicer एक Interactive Visual Filter है। इससे User Date, Region, Product और Category के आधार पर Report Filter कर सकता है।
Q36. Power BI में Relationship क्या है?
Answer: Relationship दो Tables के बीच Common Columns के आधार पर Connection बनाता है। इससे एक Table का Filter दूसरी Related Table के Data को प्रभावित कर सकता है।
Q37. Power BI में Star Schema क्या है?
Answer: Star Schema एक Data Modeling Technique है। इसमें एक Central Fact Table होती है और उससे संबंधित कई Dimension Tables जुड़ी होती हैं।
Q38. Power BI में CALCULATE Function क्या करता है?
Answer: CALCULATE Function किसी Expression को Modified Filter Context में Evaluate करता है। यह DAX का एक महत्वपूर्ण Function है।
Sales North = CALCULATE(SUM(Sales[Amount]), Sales[Region]="North")
Q39. Power BI में Drill Through क्या है?
Answer: Drill Through की मदद से User किसी Summary Visual से संबंधित Detailed Report Page पर जा सकता है। इसमें Selected Data Context के आधार पर Details दिखाई जाती हैं।
Q40. Power BI Dashboard और Report में क्या अंतर है?
Answer: Power BI Report में Multiple Pages और Interactive Visuals हो सकते हैं। Dashboard Power BI Service का Single Page Canvas होता है जिसमें विभिन्न Reports के Visuals Pin किए जा सकते हैं।
Part 5: Python Interview Questions and Answers
Q41. Python क्या है?
Answer: Python एक High-Level Programming Language है। इसका उपयोग Data Analysis, Automation, Web Development, Artificial Intelligence और Machine Learning में किया जाता है।
Q42. Pandas क्या है?
Answer: Pandas Python की एक Library है जिसका उपयोग Tabular Data को Load, Clean, Filter, Transform और Analyze करने के लिए किया जाता है।
Q43. NumPy क्या है?
Answer: NumPy Python की Numerical Computing Library है। इसका उपयोग Arrays, Mathematical Operations और Scientific Calculations के लिए किया जाता है।
Q44. DataFrame क्या है?
Answer: DataFrame Pandas का Two-Dimensional Data Structure है जिसमें Data Rows और Columns में Store होता है। यह Excel Table की तरह दिखाई देता है।
Q45. Python में CSV File कैसे Read करेंगे?
Answer: Pandas Library के read_csv() Function का उपयोग करके CSV File Read की जा सकती है।
import pandas as pd
df = pd.read_csv("sales.csv")
print(df.head())
Part 6: Statistics और Practical Interview Questions
Q46. Mean, Median और Mode क्या हैं?
Answer:
- Mean – सभी Values का Average।
- Median – Sorted Data की Middle Value।
- Mode – सबसे अधिक बार आने वाली Value।
Q47. Correlation क्या है?
Answer: Correlation दो Variables के बीच Relationship की Direction और Strength बताता है। इसका मान सामान्यतः -1 से +1 तक होता है। Correlation अपने आप Causation साबित नहीं करता।
Q48. Outlier क्या होता है?
Answer: Outlier ऐसी Value होती है जो Dataset की अन्य Values से काफी अलग होती है। इसे Analyze करके समझना चाहिए कि यह Data Entry Error है या कोई वास्तविक घटना।
Q49. अगर Company की Sales अचानक कम हो जाए तो आप क्या करेंगे?
Answer: सबसे पहले Data Quality और Data Freshness Check करूंगा। फिर Previous Month और Previous Year की Sales Compare करूंगा। इसके बाद Product, Region, Customer और Sales Channel के अनुसार Analysis करके संभावित कारण खोजूंगा।
Q50. Data Analyst Interview में अपने Project को कैसे Explain करेंगे?
Answer: मैं अपने Project को इन Steps में Explain करूंगा:
- Project का Objective और Business Problem।
- Data Source और Dataset की जानकारी।
- Data Cleaning और Transformation।
- Excel, SQL या Power BI का उपयोग।
- Analysis और महत्वपूर्ण Findings।
- Final Dashboard और Business Recommendations।
Data Analyst Interview Preparation Tips
अगर आप Data Analyst की Job पाना चाहते हैं, तो केवल Questions पढ़ना पर्याप्त नहीं है। आपको Software पर Practical Work भी करना चाहिए।
- Excel और Advanced Excel Formulas सीखें।
- SQL और Database Queries की Practice करें।
- Power BI में Data Cleaning और Dashboard बनाएं।
- Statistics और Data Visualization समझें।
- Python की Pandas और NumPy Libraries सीखें।
- कम से कम 3 Real-World Projects बनाएं।
- Resume, Portfolio और Mock Interview की तैयारी करें।
Practice के लिए 5 Best Data Analytics Projects
- Retail Sales Analysis Dashboard
- Student Performance Analysis
- Employee HR Analytics Dashboard
- Customer Purchase Analysis
- Monthly Financial Performance Report
Free Data Analyst Interview Questions PDF
इन 50 Interview Questions को PDF Notes के रूप में अपने पास रखें और Interview से पहले Revision करें।
PDF में शामिल करें:
- 50 Interview Questions and Answers
- Excel और SQL Practical Examples
- Power BI और Python Questions
- Statistics और Interview Tips
PDF Button को सक्रिय करने के लिए अपनी WordPress Media Library का वास्तविक PDF URL जोड़ें।
Related Data Analytics Articles
Data Analytics की बेहतर तैयारी के लिए हमारे दूसरे Articles भी पढ़ें:
Learn Data Analytics with Practical Training
Excel | Advanced Excel | SQL | Power BI | Data Analysis
Excellent Computer Education
A Job Oriented Computer Training Center
UG-10, Goel Palace, Faizabad Road, Indira Nagar, Lucknow
Enquire on WhatsApp View Power BI CourseCall / WhatsApp: 9795720993
Website: excellentcomputereducation.com
Frequently Asked Questions (FAQs)
1. Data Analyst Interview में कितने Questions पूछे जाते हैं?
यह Company और Job Role पर निर्भर करता है। Technical, Practical और HR Round में अलग-अलग Questions पूछे जा सकते हैं।
2. क्या Fresher Data Analyst बन सकता है?
हाँ। Excel, SQL, Power BI, Statistics और Practical Projects की अच्छी तैयारी करके Fresher भी Entry-Level Jobs के लिए Apply कर सकता है।
3. Data Analyst के लिए सबसे जरूरी Software कौन-सा है?
Excel, SQL और Power BI प्रमुख Tools हैं। Python और Tableau भी उपयोगी हैं।
4. क्या Data Analyst बनने के लिए Python जरूरी है?
हर Entry-Level Job में Python जरूरी नहीं होता, लेकिन Python सीखने से Data Analysis और Automation में अतिरिक्त मदद मिलती है।
5. Data Analyst के लिए कौन-से Projects बनाने चाहिए?
Sales Dashboard, HR Analytics, Customer Analysis, Student Performance और Financial Analysis जैसे Projects उपयोगी हैं।
Conclusion: Data Analyst बनने के लिए आपको Excel, SQL, Power BI, Python और Statistics की Practical Knowledge विकसित करनी चाहिए। इन 50 सवालों की तैयारी के साथ Real-World Projects पर काम करें ताकि आप Interview में अपने Skills को बेहतर तरीके से प्रस्तुत कर सकें।